Example 2: Discovering what we didn't know from atom
Early discoveries about atomic structure provide good examples of data that can be analyzed graphically. Sometimes, as in this example, the graph of the data is not a straight line. In this case we can linearize the graphs by manipulating the data.
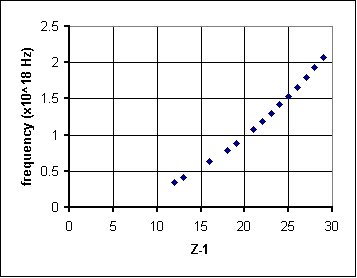
In 1913, English physicist Henry Moseley published his paper, The high frequency spectra of the elements, which explained his experiment to show that the frequency of x-rays in the K-alpha emission lines of various elements depend on a parameter equal to one less than the atomic number, that is, Z-1. This was important in establishing that atomic number is at least as fundamental a quantity as atomic mass.
Here is some of the data that Moseley presented:
| Element
|
Z-1
|
K-alpha frequency (x 1018 Hz)
|
|
Al
|
12
|
0.35
|
|
Si
|
13
|
0.42
|
|
Cl
|
16
|
0.63
|
|
K
|
18
|
0.79
|
|
Ca
|
19
|
0.89
|
|
Ti
|
21
|
1.08
|
|
Vn
|
22
|
1.19
|
|
Cr
|
23
|
1.30
|
|
Mn
|
24
|
1.42
|
|
Fe
|
25
|
1.54
|
|
Co
|
26
|
1.66
|
|
Ni
|
27
|
1.80
|
|
Cu
|
28
|
1.93
|
|
Zn
|
29
|
2.07
|
|
|
An attempt to fit this data with a straight-line graph gives a poor fit. It looks like the data curves increasingly upward from a straight line as Z-1 increases. To linearize this data, that is to rework it to get a straight-line graph, we need to stretch out the Z-1 axis. One way to do this is to raise it to a power; in our experience, nature works quite a bit with integral powers, so we can try (Z-1)2 or (Z-1)3. Here's what happens when we square Z-1:
|
(Z-1)2
|
K-alpha frequency (x 1018 Hz)
|
|
144 |
0.35 |
|
169 |
0.42 |
|
256 |
0.63 |
|
324 |
0.79 |
|
361 |
0.89 |
|
441 |
1.08 |
|
484 |
1.19 |
|
529 |
1.30 |
|
576 |
1.42 |
|
625 |
1.54 |
|
676 |
1.66 |
|
729 |
1.80 |
|
784 |
1.93 |
|
841 |
2.07 |
|
|
This looks to be a straight line par excellence with an intercept close to zero and a slope m = (2 x 10¹⁸ Hz) / 800 = 2.5 x 10¹⁵ Hz. If we follow the pattern y = mx + b for a straight line, our x is (Z-1)2 and our y is frequency f. Then we can say
f = (2.5 x 10¹⁵ Hz)(Z-1)2
where f is frequency and Z is atomic number.
In conclusion, we were able to take a dataset that gives a non-linear graph, linearize it, and use the resulting straight line to come up with a reasonable mathematical equation for the physical behavior of the system. Hee haw!
Time for another challenge . . .
