Getting to Higgs
Understanding Data: Forms of Data
Forms of Data - Analysis Help
|
Event Pictures: Imagine protons and anitprotons are moving through a beam pipe perpendicular to the screen (or page) through the center of the event picture. Event pictures like these are cross-sections of the target area transverse to the beamline, (in the x-y plane). The curves and lines are tracks of charged particles. Neutral particles do not leave tracks. Since the detector has a strong magnetic field, charged particles make curved tracks. Very energetic charged particles make tracks that look straight but are really slightly curved. We call the point where the tracks begin the vertex. By examing these tracks and how much they bend, you can determine: |
|
Particle energy and mass - we can use the momenta of particles, together with Conservation Laws, to infer energies and masses. | |
|
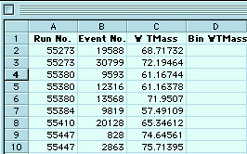
Excel Spreadsheets: An electronic spreadsheet is a table of data that you can manipulate on your computer. Our spreadsheets have the data from as many as 49,000 interactions of the same type so you can analyze them all at once. |
|
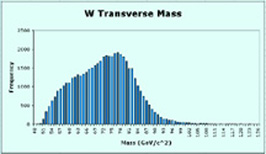
Histograms: MS Excel allows you to make histograms of large amounts of data. In a histogram, the full range of the data is broken up into equal ranges called bins. The number of data points in each bin is plotted. In our data plots, the bins are ranges of masses or lifetimes. The number of events that fall within each bin is recorded and plotted on a graph. In this histogram the peak indicates the mass of the particle as measured in this experimental run. The size of the bin is important in order to find the peak—too wide or too narrow and you may miss it. |
| « Back to: Identifying B - Identifying W |