|
It's a Wonderful Line: Data Analysis Using Graphs |
|
|
|
It's a Wonderful Line: Data Analysis Using Graphs |
|
Example 3: Getting on the level with electron energies
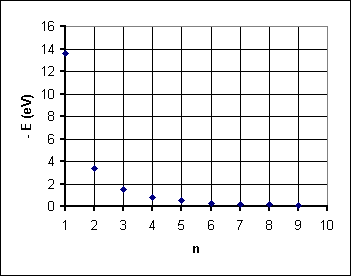
Another key discovery in atomic structure was quantized energy levels by Max Planck. This discovery was followed by Bohr's famous early quantum model of the atom which still has great conceptual appeal today. What's more, it gets the energy levels for the electron in the hydrogen atom just about right. The data below represents data that might have been recovered from an early experiment using spectral lines to find hydrogen energy levels. Note that "negative"energies are reported: this is because we normally associate E = 0 with a free electron at rest. Electrons bound to the atom have negative potential energy as a result—and positive kinetic energy that is about only half the magnitude of the potential energy.
Energy Level Quantum Number n Negative Energy (eV) 1 13.6 2 3.4 3 1.5 4 0.8 5 0.5 6 0.3 7 0.2 8 0.2 9 0.1
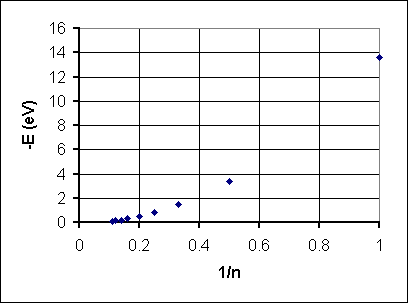
The graph shows negative energy decreasing as n increases. This could be a negative exponential function or (more likely) an inverse function, that is n ~ 1/(-E). Here's how that works out:
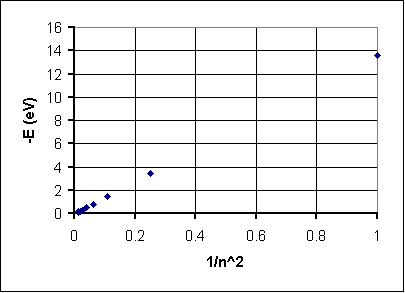
Well, we've turned the graph around but it does't look quite straight. Let's try stretching the 1/n axis by changing it to 1/n2:
Aha! Lassoed! This looks like a straight line with a zero intercept and a slope (if you work it out carefully) of 13.6 eV. That means if we adapt fromy = mx + b we get-E = (13.6 eV)(1/n2) + 0 orL E = (-13.6 eV)/n2 If you like, we can render thisE = Eo/n2, where Eo = -13.6 eV Not only does this work, but it is in fact the standard energy quantization relationship for a hydrogen atom.
Let us now follow that line of thought about exponentials . . .
Example 2 Example 4