Overview of Stellar Spectra | Finding Spectra | Plotting and Measuring Spectra | Classifying Spectra | Links
We have all looked to the night sky and seen the many stars illuminating the otherwise dark backdrop. If you haven't been amazed by this, you must not be seeing what everybody else is. But what is a star? Basically, it is just a big ball of "burning" gas. There are well over 100 billion stars in the Milky Way Galaxy alone, each with its own unique size, mass, temperature, and color. If stars have different colors, why do they all appear white in the night sky? The stars in the night sky are so far away, that the light given off by them is too dim for our eyes to see the different colors. If we were to look at the same stars with the help of a telescope, the different colors would become more apparent.
Since the beginning of the human race on this planet, people have wondered about the stars and have tried to learn all they can about them. The first step in understanding stars is to observe them and classify them. One of the very first classifications of stars was made by ranking how brightly they shined in the night sky and grouping similarly bright stars together. Although there was no hard scientific evidence supporting the data at the time (the observations were made by simply looking at the sky with the naked eye), it was a way to organize stars which helped astronomers learn more information about them.
A spectrum is a graph of the amount of light something gives off (how bright the object is) at different wavelengths. In the spectra of stars, we frequently do not know the distances to the stars, so a star's spectrum shows how bright it appears from Earth. One easy way of splitting light, which can be used to see its spectrum, is with a glass prism.
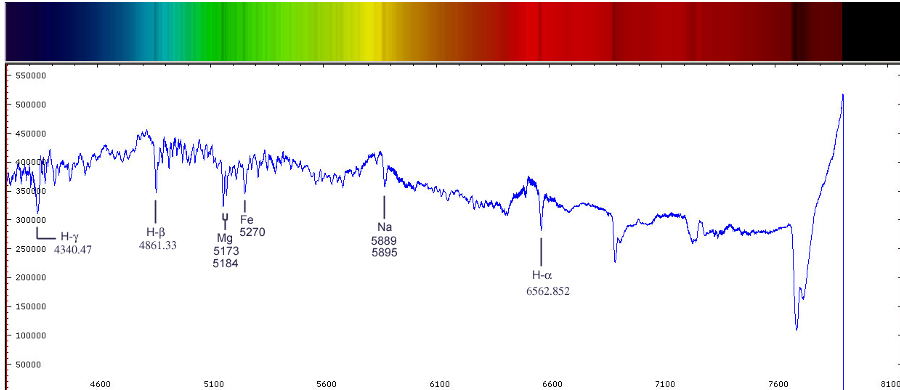
A Stellar Spectrum
Believe it or not, visible light is only a very small fraction of all the light in the world. Below is a picture showing the different types of light and at what frequencies they occur at. From largest wavelength to smallest wavelength, the different types of light are radio waves, microwaves, infrared radiation, visible light, ultraviolet radiation, x rays, and gamma rays. It is easily seen in the picture that all of the visible light, colors, and everything we see each day only consist of a tiny portion of all the light. It can also be seen in the picture that visible light spans from about 400 nanometers to 700 nanometers and as the wavelength changes, so does the color. Red has the longest wavelength, followed by orange, yellow, green, blue, indigo, and violet, hence the infamous ROY G BIV expression.
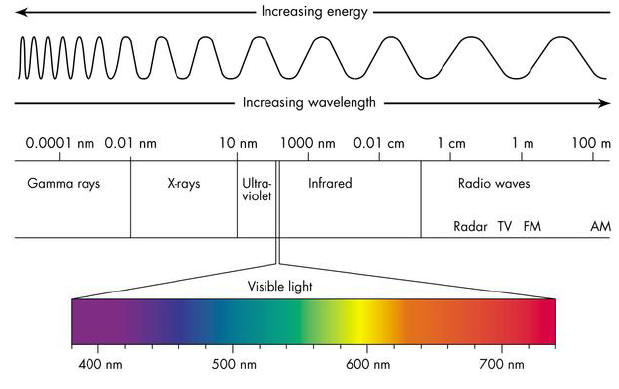
The Electro-Magnetic Spectrum
To Complicate matters further, many telescopes cannot even see all visible light, the chart below shows the frequencies of light that three important telescopes can see
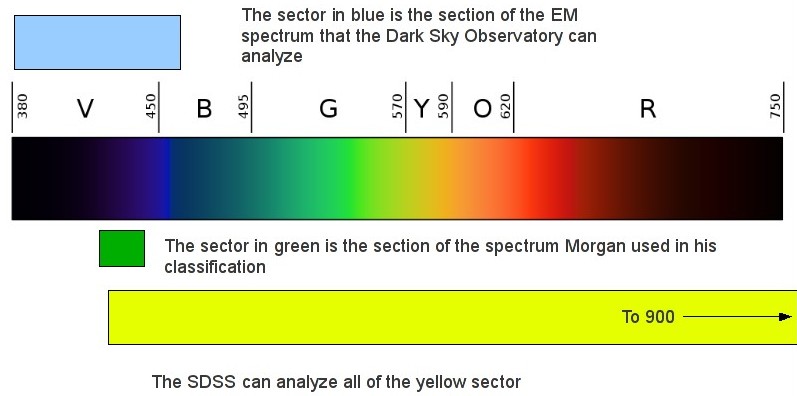
Coverage of the Electro-Magnetic Spectrum in Varying Telescopes
In the late 1800s an astronomer at the Harvard College Observatory began to record stellar spectra, using a method similar to the glass prism described above. The first star looked at was noticed to have "gaps" or "breaks" in the spectrum at specific points, called absorption lines. This first pattern was called "A". If the next star spectrum had similar absorption lines in the spectrum to the first, then it too would be classified as an "A". However, if the absorption lines were not similar to the first star, it was classified as a "B". This went on until all of the stars recorded were categorized with a letter between A and Q.
It was later realized that this classification was based on temperature. After merging some of the categories together, we are left with O, B, A, F, G, K, and M stars. in that order, the temperature changes from hottest (more than 10,000 degrees Kelvin) to coldest, less then 3,000 degrees Kelvin. Furthermore, the numbers 0-9 were added at the end of the letter to further divide the stars. For example, a B0 represents the hottest star in the B series, while a B9 represents the coolest star in the series. Our sun is classified as a G2 star. A way to remember the order of classifications is to use the mnemonic device, Oh Be A Fine Girl/Guy Kiss Me.
In the beginning of the 1900s, William Wilson Morgan, pictured below, along with Philip C. Keenan and Edith Kellman from Yerkes Observatory used these same categorizing letters, but added a second dimension to the scheme: luminosity class. Following the scheme set up by Father Angelo Secchi, they used 0, I, II, ..., VII to indicate luminosity class, measured by how wide absorption lines appear in the spectra: lass 0 for stars with narrow lines, I for stars with slightly broader lines, and so on, up to V, VI, and VII. This is called the MKK system.
William Wilson Morgan
Our project this summer was to apply the MKK stellar classification system to Sloan Digital Sky Survey (a telescope project here at Fermilab) data. To do this we followed a few basic steps: