Overview of Stellar Spectra | Finding Spectra | Plotting and Measuring Spectra | Classifying Spectra | Links
Any spreadsheet program with the ability to create graphs can be used to plot and measure spectra. Plot wavelength on the X axis, and flux on the Y axis. To zoom in on any specific line, change the minimum and maximum values for the X axis to include only the line you are interested in.
To compare strengths of absorption lines, equivalent widths are used. The equivalent width of an absorption line is a measure of the area of the absorption line. The width of a rectangle with a height equal to that of the continuum that has the same area of the absorption line is the equivalent width.

An Explanation of Equivalent Widths
This equation was used to calculate the equivalent widths of important absorption lines, as labeled so by the MKK book.

The Full Equation to Calculate Equivalent Widths
A is the area of the peak.
a is the height of the peak from top to bottom.
sigma is the full width of half the maximum divided by 2.35 (more info to come...)
Sigma is multiplied by the square root of 2 pi, whereas pi is 3.14159
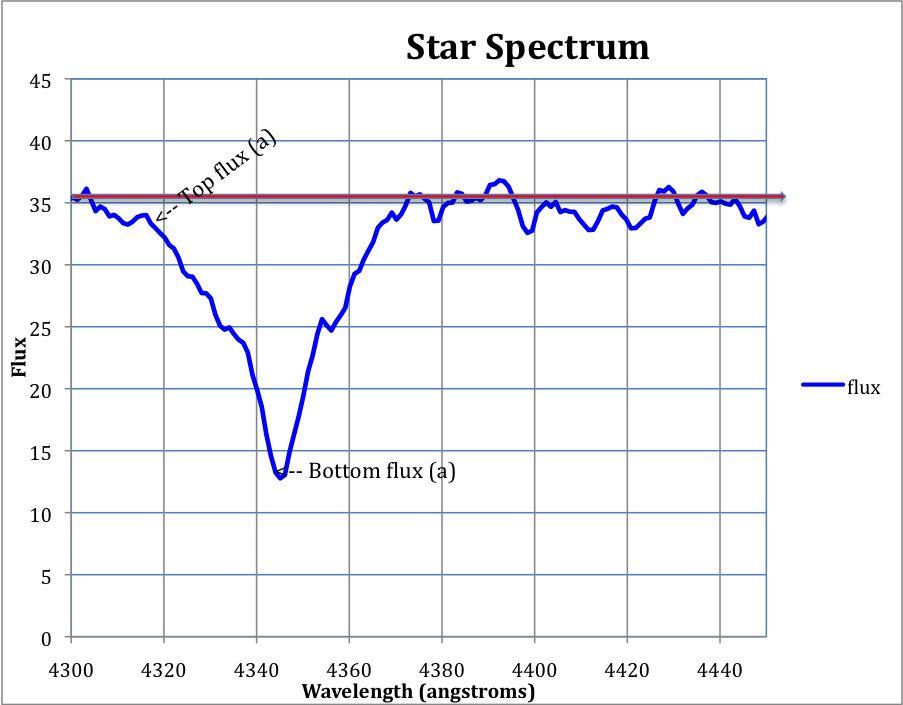
Step 1: Find a. To do this you must find the difference of the highest and lowest part of the peak. It is referred to as Top flux and Bottom Flux. So, a = Top flux - Bottom flux.
Step 2: Find sigma. Start by finding the middle flux, which is the average of the Top flux and Bottom flux. Then, draw a line across the peak at that point. Next, record the left and right side of the peak's wavelength at the intersection of the line. Find the difference between the two wavelengths. Finally, divide that number by 2.35. The answer is sigma. So, (Top flux + Bottom flux)/2 to find the full width of half maximum. Then, right wavelength - left wavelength/ 2.35.
Step 3: Multiply by the square root of 2 * PI.
Step 4: Now that all parts of the equations are known, you can compute for A by multiplying your results from step 1, 2, and 3.
Example using data from graph above.
Step 1:
a=35 flux - 13 flux
a= 22 flux
Step 2:
mid flux= (35 flux + 13 flux)/2
mid flux= 24 flux
Draw mid flux line at 24 flux
Step 3:
The square root of (2 * 3.14159) = 2.507
Step 4:
A = [a * sigma * sqrt(2*PI)]/ Top flux
A = (22 * 7.66 * 2.507)/35 = 12.07 Angstroms
The eye method is simple. The Continuum, FWHM, and Amplitude, are estimated after zooming in on a particular absorption line. The values are then plugged into an spreadsheet formula to calculate the Equivalent widths. A sample spreadsheet can be found here
One of the summer students created a set spreadsheet templates to use in calculating equivalent widths. These templates take into account the problem of measuring a absorption line with flanking absorption lines obscuring the true amplitude and continuum. There are templates for one, two, and three lines
IRAF (an acronym for Image Reduction and Analysis Facility) is a fully featured, professional astronomy program. It has built in routines for calculating equivalent widths. However it is very difficult to install, learn, and use.
One of the summer students managed to install it on his Linux netbook, and found this link on how to install it on Ubuntu