|
|
Histogram Test Drive
|
|

|
|
Try These Problems:
- A batch of resistors is tested to see how close they come to the manufacturer's specification of 47 ohms. Data is tabulated in bins of
0.2 ohm as follows:
|
Resistance (ohms)
|
Frequency
|
|
46.0-46.2
|
3
|
|
46.2-46.4
|
5
|
|
46.4-46.6
|
6
|
|
46.6-46.8
|
9
|
|
46.8-47.0
|
5
|
|
47.0-47.2
|
6
|
|
47.2-47.4
|
5
|
|
47.4-47.6
|
2
|
|
47.6-47.8
|
3
|
|
47.8-48.0
|
1
|
Make a histogram of this data. From your plot, estimate the median resistance. What can you say about the accuracy and the precision of the manufacturer's specified resistance of 47 ohms?
- Using their cosmic ray detector, teachers in the University of Rochester QuarkNet Center take counts of incident muons per minute at a given location to see if they can get a good "average" value for that place. Over the next 20 minutes, the following counts are taken:
{98, 103, 104, 103, 101, 98, 99, 104, 100, 104, 98, 103, 105, 103, 102, 104, 104, 103, 99, 100}
Make a histogram; calculate the median and the mean. How close are they to the peak of the histogram? How well-defined is the peak?
- For the following dataset, decide on a bin size and make a histogram. Change the bin size and make another histogram. How do the two compare?
{0.11, 0.20, 0.35, 0.21, 0.28, 0.03, 0.22, 0.21, 0.19, 0.06, 0.40, 0.20, 0.31, 0.25, 0.27, 0.18, 0.17, 0.22, 0.45, 0.01, 0.14, 0.23, 0.26, 0.13, 0.19}
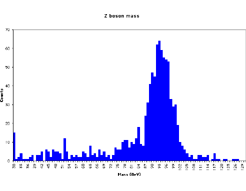
- Refer to the histogram below:

Can you identify the main peak? Can you find 1-2 "bumps" in the data? What would you say the "noise level" of the data is (that is, at what frequency level does the data lose statistical significance)?
BACK
Project Contact: Ken Cecire
Web Maintainer: qnet-webmaster@fnal.gov
Last Update: February 14, 2002


