Getting to Higgs
Measurements have errors! Fitting a Curve
The top quark mass is 173.8 plus or minus 5.2 GeV.Vinland Map parchment dated to 1434 plus or minus 11 years.
66% of Americans think it is morally unacceptable to clone animals. |
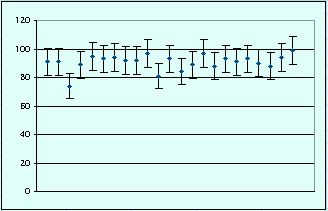
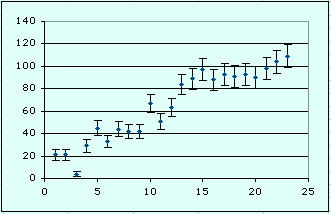
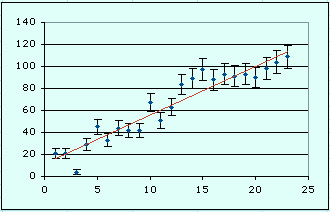
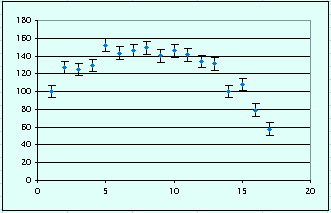
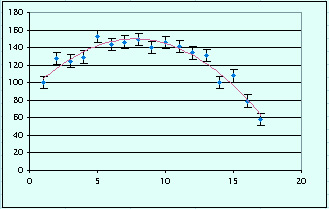
Our goal is to measure the "true" value of the W mass. Actually, this true value is elusive but is our goal. We show the errors associated with our measurements by including error bars on the graph. Rather than connecting the data points we measured, we fit the data with a curve (which may be a line) that takes the errors into account. There are many statistical software packages that fit curves. Excel can fit some kinds of data, however, not W and Z mass measurements. We have to fit that data by drawing a curve by hand. To do that we eyeball the data and draw a smooth line or curve that follows the general path of the data points. | |
|

|
|
|
|
|
| « Back to Evidence for W |