Getting to Higgs
Calculating Higgs Mass
We have provided data from 3000 candidate Higgs events. All of these events contain a W and two jets identified as b quark jets, but most events do not contain a Higgs. The only way to tell if the events contain W and H is to look at the "invariant mass" of the b quark jet pair. If the b jets come from a Higgs, they will make a peak in the invariant mass plot at the value of the Higgs mass.
To calculate the Higgs mass:
|
|
A |
B |
C |
D |
E |
F |
G |
H |
I |
M |
|
1 |
Run No. |
Event No. |
pt
jet 1 GeV/c |
pz
jet 1 GeV/c |
φjet1 radians |
pt
jet 2 GeV/c |
pz
jet 2 GeV/c |
φjet
2 radians |
m from jets GeV/c2 |
Mass Bins |
|
2 |
100237 | 5128 | 137.67 | -189.42 | 6.03 | 51.71 | -179.40 | 4.03 | 159.3734 |
|
| 3 |
100474 | 5251 | 23.77 | -63.15 | 1.36 | 18.24 | -23.96 | 4.19 |
|
|
2. Make a histogram (with bin width 5 GeV) for the Higgs mass + background.
Your plot shows masses from the background with a peak at the Higgs mass. Notice the "bump" of many events of about the same mass in your plot. What do you think the Higgs mass is from these data?
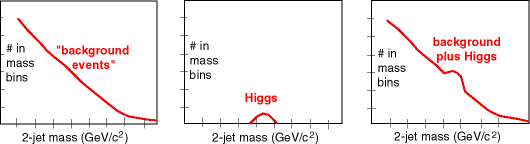
Often a mass plot has many particles at low mass and fewer and fewer at larger masses. These data have been cut to eliminate very low mass-energy particles. |
4. Subtract the expected background.
Get the data with the expected background events.
Make a histogram of the two-jet mass for the expected background exactly as you did for the observed data.
| Copy the histogram frequency column and paste it in column C in your original histogram.
In column D subtact the value in Column C from the value in Column B (observed mass - expected background mass). Make another column which is error on this value, =SQRT(B2+C2) and Fill Down. Highlight columns A and D. Plot the frequency versus mass. You should now have a mass plot which comes from the Higgs contribution to the original observed data. What is the Higgs mass from these data?
|
| ||||||||||||||||||||||||
Congratulations, you have done your first high-energy physics data analysis!